Editorial Team
10 min read
Help improve profits by discovering which products are boosting your bottom line and which might be holding you back. With this streamlined approach, you’ll learn how to discover opportunities to grow profits without getting bogged down in data.
Understanding product-level profitability is crucial for every small business. This analysis will help you make better-informed decisions about product pricing, selection, and promotional strategies.
The challenge is that it can be very tedious and time-consuming. But it doesn’t have to be. With the right tools and a practical approach, you can quickly start measuring and improving your profitability.
This guide will provide you with an efficient and effective method for understanding and improving product-level profitability.
Choose practicality over perfection
Embarking on profitability analysis can seem overwhelming. Yet, it’s important to remember that actionable data is far better than perfect data. So, it’s not as difficult as it may seem at first.
Precision is critical in income statements and other regulatory-driven accounting functions. However, as a decision-support tool, product-level profitability analysis just needs to be “directionally correct.” By pointing you in the right direction, you can quickly implement changes to help improve profitability.
You simply start by calculating the profitability of your most important product. And then your second-most important product. And so on for the rest of your top products. At this point, you’ll be able to estimate the rest of the products without a significant impact on the quality of the analysis. We’ll delve deeper into this approach later.
Once you start seeing the profitability trends for your top products, you will be motivated to dive deeper because of the great insights you’ll find. You’ll also start to learn where more (or less) accuracy is needed in this analysis.
Clearly define metrics
Clear and consistent definitions of “sales” and “cost” are vital to ensuring an accurate profitability analysis, as well as well-informed decisions based on this analysis.
Profitability is simply sales minus cost. However, these terms can have varying definitions based on industry and context. Fortunately, you can define these terms to fit your specific needs – as long as you are consistent.
- Sales. “Sales” (or “revenue”) is easier to define. For small businesses, the ambiguity typically centers on whether to count service charges as sales and whether to deduct delivery service commissions from sales. Since profitability analysis isn’t bound by strict accounting standards, use the definitions that make the most sense for your business. For example, if service charges go to employees as tips, exclude them. Delivery commissions are typically excluded from sales to provide a more accurate comparison with other sales channels.
- Cost. “Cost” (or “expense”) has more ambiguity, but the general rule of thumb is to include all costs directly related to acquiring or producing your products. For example, if you sell t-shirts, simply use the amount you paid your supplier for each t-shirt. If you make custom t-shirts, use the cost of the t-shirt, the cost of supplies to customize it, and the labor cost for the customization work. You should typically exclude fixed costs like rent, as well as general expenses like marketing, from these calculations.
For those familiar with accounting terms, this approach calculates gross profit by subtracting the cost of goods sold from revenue. But again, this is not an accounting exercise, so define these terms so they make sense for your business. Just be consistent.
READ: Know your numbers: 5 keys to improving business performance
Identify benchmarks
Using standardized definitions makes it easier to find general industry benchmarks for comparison. For example, the RMA Statement Studies (available for free at some local libraries) show that the gross profit margin for bakeries is 62.7%.
You can also use consulting experts from your local SBDC or SCORE chapter to help set realistic benchmarks for your business.
Ultimately, your most important and useful benchmark will probably be your historical performance. Comparing current profitability to past results can provide a tangible measure of progress.
Start simple
Note: The following methodology is built into the Manage My Business app for Clover, but feel free to use any other profitability analysis tool (including spreadsheets) that you prefer.
Calculating the profitability of every product is not practical or necessary. Instead, start by estimating your gross profit margin for the entire business as well as for each category. This provides a reasonable starting point for all of your products. Then, focus your time on doing a detailed cost analysis for your most important products to improve the accuracy of this analysis.
- Overall profitability. Use a recent income statement to get the gross profit margin for your business.
- Category profitability. Focus on categories that deviate from your overall profitability. For example, bottled drinks (water, soda, etc.) sold by a coffee shop typically have a higher margin than espresso-based drinks. As such, estimating your profit margin for the Bottled Drinks category can help improve the accuracy of your analysis.
- Product profitability. Rank your products by sales volume and then calculate product profitability in this order until you stop seeing a meaningful impact on the analysis. Remember, “good enough” is far better than perfect.
If you’re using the Manage My Business app, simply enter these values into the Profitability Analysis section. The profitability metrics and graphs will update automatically.
Calculate product costs
It’s easy to determine the cost of simple products like a t-shirt or bottle of water, but what about more complex products like a baked-from-scratch cupcake? Let’s walk through this example to highlight where shortcuts can simplify this process.
- Ingredients cost. Cupcakes are made in batches, so let’s say a recipe produces a batch of 100 cupcakes. Using the recipe, sum the cost of each ingredient and divide by 100 to get the per-cupcake ingredient cost.
- Variances. If you make different flavors of cupcakes and the recipes vary in meaningful ways, do this exercise for three of the most popular flavors and average the cost. It’s easy to see how precision is unattainable, but it’s also unnecessary. Just get reasonably close to a good estimate. You can always refine this later.
- Direct labor costs. Include labor costs directly attributable to product production. Estimate the time to make a batch of cupcakes from start to finish, excluding any idle time (such as baking time or cooling time) that could be used for other tasks. Multiply this time by the average hourly pay rate for a baker, and then divide by 100 to get the per-cupcake labor cost. Add this to the cost of your ingredients to get your total cost per cupcake.
One additional layer of complexity exists for products with variable prices, such as a latte. The cost will vary based on perhaps thousands of combinations of factors such as cup size, extra shots, flavors, or specialty milks. There are a couple of solutions for this issue:
- Focus on the “average” product. If you offer small, medium, and large lattes, calculate the cost of the typical medium latte, and apply it to all latte sales. This is simple and more accurate, as long as the quantities of small and large lattes are roughly equal.
- Calculate the cost as a percentage of price. Calculate the average cost of a typical latte and convert this to a percentage of the price. For example, let’s say your cost for a typical latte is 30% of the price. In this example, a $6 latte would have a calculated cost of $1.80 (30% of $6), and a $4 latte would have a cost of $1.20 (30% of $4). This approach is more accurate, as long as your price for each product variant is roughly aligned with your costs.
Remember, the goal is to get a reasonably good estimate, which you can refine over time.
One final recommendation is to take notes on how you calculated the cost for each product so you can replicate this process in the future, as you will need to repeat this process from time to time. The first time is the hardest, but you can make subsequent estimates much easier and more consistent by documenting your assumptions.
Analyze and visualize profitability
Through the simple act of calculating costs, valuable insights often emerge. In the cupcake example above, you might find that one ingredient (like vanilla) has a significant impact on the cost. This could lead to ideas to tweak the recipe, seek cost-effective alternatives, or even find a new supplier – ideally without compromising the quality of your product. Moreover, examining labor costs might uncover opportunities for efficiency, like simplifying production steps or investing in more capable machinery to improve automation or scalability.
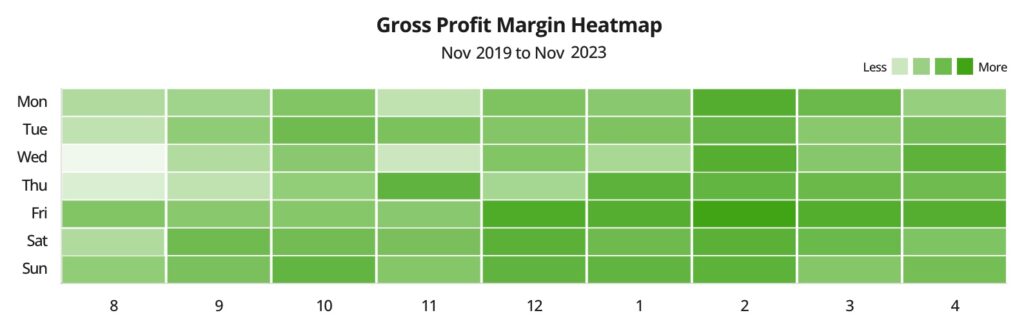
Visualization tools transform data into actionable insights. A Gross Profit Margin Heatmap, for example, can highlight which times of day or days of the week yield higher profits. A restaurant may find their breakfast orders are wildly profitable, but they lose money during the lunch hour.
In the following example, you can see that this business is more profitable in the afternoons (shown by the darker green color):
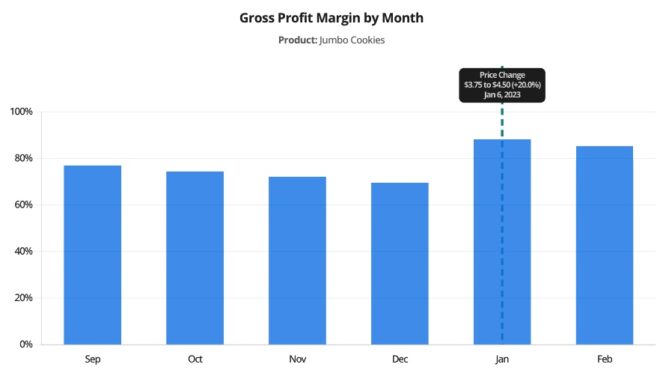
Once you’ve updated your costs over a period of months or years, trend graphs become really useful. For example, if your costs are rising over a few months, you will see your profit margin shrink over that same period. This graph becomes a good indicator of when to consider raising the price of that product. In the following example, you can see the profit margin was falling because of rising costs until a price increase returned it to a healthier level.
Take action
Analytics are only useful if you take action, so here are some ideas for how to use these insights to help improve your business’s profitability:
- Pricing. You should typically price each product based on its perceived value, not its production cost. However, a shrinking profit margin may indicate the need for a price increase. If the market is resistant to a price increase, you could consider discontinuing the product or changing its perceived value – such as by enhancing the cupcake decorations. Conversely, a very high-margin product that is not selling well might indicate an opportunity to grow sales by lowering the price.
- Cost control. Identifying the most expensive ingredients can focus your efforts on experimenting with less expensive alternatives. There’s always a risk of eroding product quality by using cheaper ingredients or suppliers, but that’s not always the case.
- Product development. Eliminate lower-margin products if you don’t believe it will affect customer loyalty, and then focus on adding new products with higher margins. Over time, your product mix will become more aligned with your profitability goals.
- Day/time analysis. Look at profitability by the time of day and day of the week. If there are noticeable differences, use this insight to focus on which types of products (e.g., the weekday lunch menu for a restaurant) need the most attention.
- Promotions. Focus your social media posts and other marketing resources on high-margin products, especially those with high growth potential.
- Sales channels. Some sales channels, like delivery services, charge a commission on each order. Evaluate the profitability of each channel after removing these commissions from sales to determine whether to continue using that channel.
These are just a few examples. The deeper you get into product-level profitability analysis, the more you’ll find that almost every decision is impacted in some way. The result can be a more profitable business.
Next steps
Repeat the process of updating your product costs regularly – perhaps every 3-6 months. Costs are changing rapidly right now, so a year-old estimate probably isn’t relevant today (except for comparisons over time). Remain focused on your key products and make updates whenever a significant change occurs to the underlying costs.
Boosting profits begins with the often challenging task of analyzing product-level profitability. However, by embracing this practical, streamlined approach, you can start quickly making decisions that incrementally steer your business towards greater financial success.
To learn more about using Manage My Business with a Clover POS, visit the Clover App Market.
This information is provided for informational purposes only and should not be construed as legal, financial, or tax advice. Readers should contact their attorneys, financial advisors, or tax professionals to obtain advice with respect to any particular matter.
Related Posts

Full Service Restaurants (FSR)
Using memberships and subscriptions to grow your business

Simplify business management with ABC Paper Rolls
Popular Topics
Stay in touch
Sign up and learn more about Clover.
More posts about starting a small business


eBook