Editorial Team
6 min read
“Know Your Numbers” typically refers to personal health metrics like blood pressure, weight, and cholesterol levels. You and your doctor use these numbers to measure your health and find early indicators of potential issues.
The same concept applies to your small business. If you only measure success by a stable or growing bank account, that’s the same as saying you’re healthy because you feel good today. Just like your health, there are simple and actionable performance metrics that will help you better understand your business and uncover both opportunities and potential issues.
1. Start simply
You do not need to become a data scientist to make sense of small business metrics. But it is easy to get overwhelmed, so start simply and build from there.
Start with the Clover dashboard or look at analytics apps in the Clover App Market to find one that fits your needs. For example, apps like Manage My Business focus on uncovering insights for you, while others provide very detailed reports for you to analyze. Use whatever is comfortable.
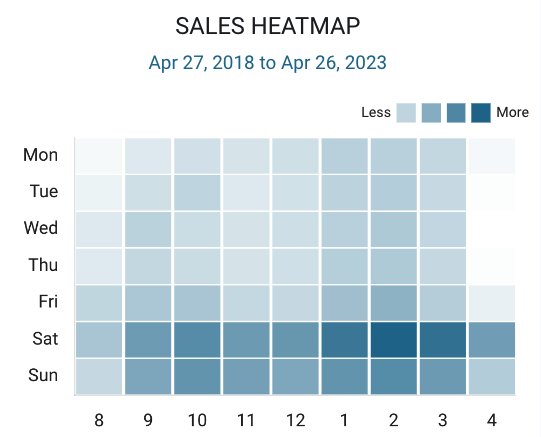
Sales is one of your most important metrics, so start there. A “heatmap” graph is an excellent way to visualize your sales by time of the day and day of the week. In this example, it’s easy to see the busiest day is Saturday and the slowest hour is 4-5 pm on weekdays−perhaps indicating the need to close an hour earlier on weekdays. Looking only at daily or weekly sales hides these insights.
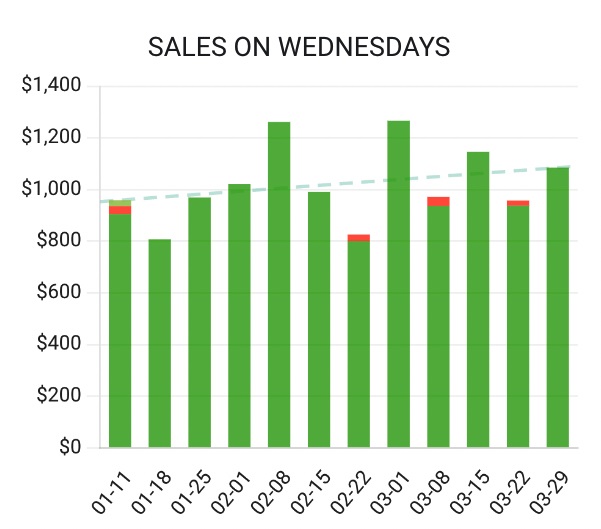
Similarly, trend graphs often provide useful insights by providing a “big picture” view of performance. This example shows sales on Wednesdays are increasing over time, which could indicate a normal seasonal trend or the success of a new promotion on Wednesdays (like a Senior Day discount).
After looking at sales from different perspectives, start looking at other metrics like order size, which can measure how effectively you maximize sales for each customer. The key is to avoid getting overwhelmed and frustrated. Start simply and you’ll find you get more comfortable with analytics every day.
2. Only use apples-to-apples comparisons
Most analytics tools can compare today’s sales to yesterday or a week ago. But what if it’s noon today and your business is still open for several hours? Comparing a partial day to a full day is misleading. However, comparing sales as of noon today to sales as of noon yesterday is useful because it’s an apples-to-apples comparison.
A similar issue arises when comparing yesterday to the same date a year ago. Those two dates will always be different days of the week, so a much better year-over-year comparison is actually 364 days apart (exactly 52 weeks).
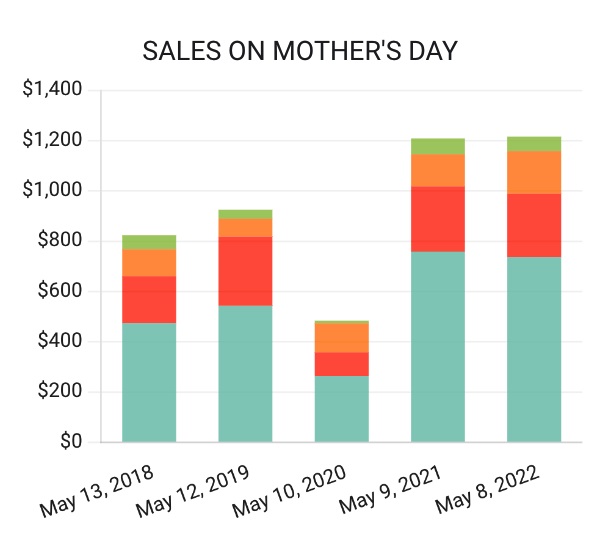
Comparing year-over-year sales for holidays like Mother’s Day is even trickier, as Mother’s Day was May 8 in 2022 but is May 14 in 2023. Analytics tools that understand holidays make this type of apples-to-apples comparison easy. There are many more examples like this, so always double-check that your comparisons are valid (or choose a tool that only shows apples-to-apples comparisons). This will help avoid flawed decisions based on skewed comparisons.
3. Keep everything in context
It’s easy to misinterpret or misuse data, especially when it’s taken out of context. You know your business well, so make sure all metrics are interpreted within the context of your business.
Let’s consider the heatmap chart above where 4-5 pm on weekdays is the slowest hour of the day. Perhaps this slow time is beneficial as it allows the employees to start pre-closing work and leave a little earlier−thereby reducing payroll costs while still offering convenient and consistent store hours. Maybe this business sells perishable products (like a bakery) and is running out of product too early each day. Closing an hour early might be the right action to take. Putting the data into context can help you make a better-informed decision.
Keep external influences in mind as well. For example, COVID-19 caused order size to increase for many small businesses as consumers bought larger quantities to reduce trips outside the home. The order size then decreased as life slowly returned to normal. A decrease in order size is usually a negative indicator, but this external factor explains why it might not be a cause for concern in this situation.
The best analytics tools provide context whenever possible, such as comparing your price increases to everyone else’s (the Consumer Price Index). But in most cases, you have to put the data into context because you have knowledge about your business that isn’t available to the analytics tools.
4. Keep asking “Why?”
Analytics are only useful when you can identify why something happened and apply that insight to improve future performance. As you look at your performance data, ask yourself why something happened−regardless of whether it was a positive or negative change. Negative results tend to draw our attention, but there’s a lot to be learned about why performance improved as well.
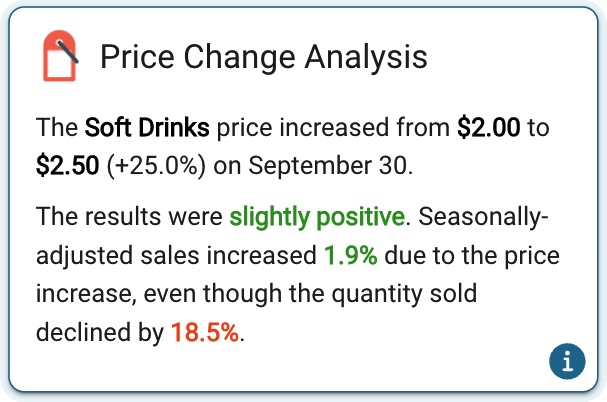
For example, price changes can obviously affect sales and profitability. The best analytics tools will clearly explain what happened, but it’s harder to explain why it happened.
In this example, a price increase for soft drinks caused a big drop in quantity sold. Why did this happen? Perhaps the price increase was too big or too soon after the last price increase. Or a competitor’s price is now lower. Or customers are buying a less expensive (and possibly less profitable) alternative from the business (e.g., customers asking for a cup of water). It could even be that the drop in quantity sold had nothing to do with the price increase, but resulted from an external market factor (such as a trend toward healthier drink options).
So, keep asking, “Why?” It’s a never-ending process, but that’s part of the fun of owning a small business. It’s a series of challenges that push you to find new and innovative ways to create great products and customer experiences. And in the end, that’s what makes your business special.
5. Trust your (informed) gut
You have a passion for what you’re selling−whether it’s coffee or antiques or whatever motivated you to start your business. As a result, you are a subject matter expert for your business and will have good instincts about how to run it.
Analytics is the perfect complement to your expertise and instincts because it provides insights that may not be obvious from just observing the day-to-day business. But going overboard with analytics can be just as bad as ignoring them. It’s the balance between expertise, instinct, and data-driven decisions that can help ensure your business’s success.
Said another way, big businesses are often data-driven machines with little or no “heart.” Small businesses are often all “heart” with limited use of data. Small businesses can beat big businesses by combining their “heart” with a more data-driven approach.
Next steps
Get to know your numbers by finding a dashboard or analytics tool that supports your business needs. Big businesses have teams of data scientists doing this analysis, but a data-focused mindset−along with your existing expertise and instincts−can give your small business a big edge.
Want to gain more insights into your business?
TRY MANAGE MY BUSINESSRelated Posts

How to determine and measure your restaurant KPIs

Full Service Restaurants (FSR)
What is restaurant tax? What business owners need to know
Popular Topics
Stay in touch
Sign up and learn more about Clover.
More posts about starting a small business


eBook