Editorial Team
6 min read
If you’re looking for ways to improve sales and need some ideas, try checking out what your data tells you. If you have a website, Google Analytics is a free program that reveals critical information about your most valuable customers, from demographics to what they look at before deciding to buy. There are so many wonderful things that are hidden in the data if you know where to look. Here are 3 steps you should take to reveal gems hidden in your data.
Step 1: Set goals
Every website, and every page on your site, should have a goal. Goals can be anything: encouraging an in-store visit, collecting a prospective customer’s contact information, signing up for coupons, or purchasing right off the site. Goals are not only important for figuring out how well your business is performing. Having a goal in mind when you design the page will help make sure customers visiting the site take the next step toward purchasing. Setting goals is an easy way to tell Google Analytics which data is most important to you.
For an ecommerce site, the most important goal is to make a sale. After making a purchase, the customer gets a “Thank you” page. Ask your web designer to insert code on this page so that every time a customer makes a purchase, Google Analytics takes notice and you can segment out that data later. Then set the goal up in Google Analytics under the “Admin” tab. Make sure you also assign a value to each goal. If the customer made a purchase, determining their value is easy. But you should also assign values to other behaviors like signing up for alerts or coupons. Later, when you analyze your data and see how many visitors you didn’t convert to a sale, you can get a better sense of how much potential revenue that customer would have given you had you converted them.
Step 2: Determine the demographics of your most valuable visitors
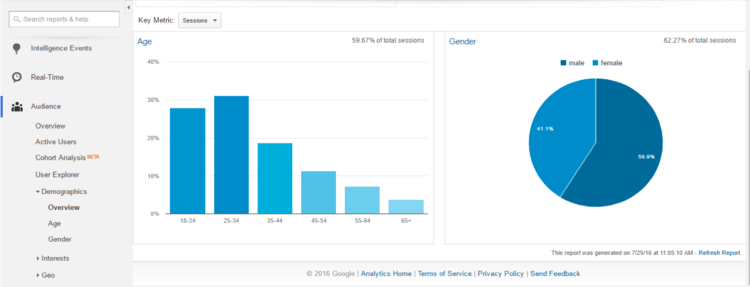
You probably have a picture in your mind of your ideal customer. But how do you know if that picture is accurate? Take a look under the “Audience” tab and click on Demographics. The overview gives basic demographic information on the visitors to your site such as age and gender.
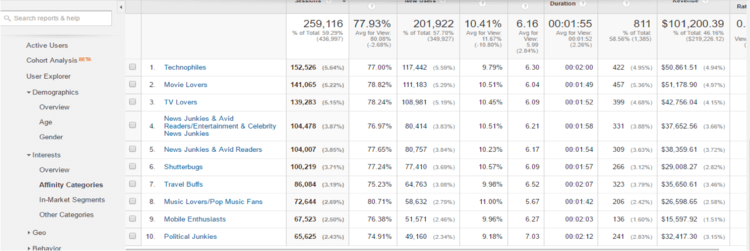
More interesting is to click on the “Interests” tab and then click on “Affinities” or “In-Market Segments”. This will give you an indication of the types of websites your visitors also browsed, and it sometimes also indicates products they would also be interested in.
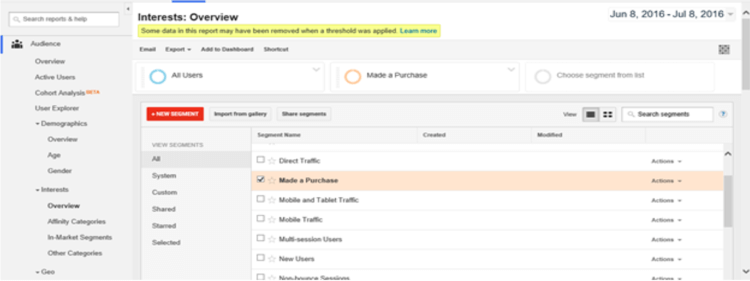
If you established goals, you can also segment out categories of people who visited your site. Simply click at the top on “Add Segment” and choose the segments you want to view. For example, you can view only the web traffic of people who purchased from you. That separates out people who are just window shopping and give you real information on who your most valuable visitors are.
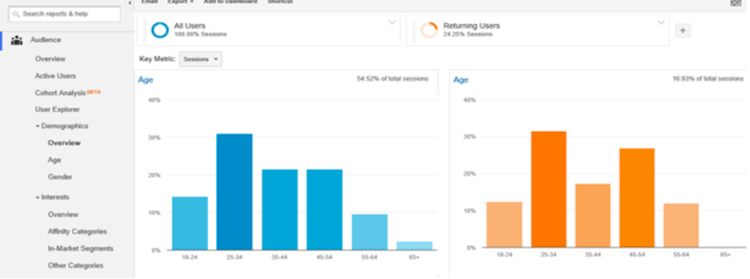
Even if you haven’t set up goals yet, there are some types of traffic you should be able to segment out. Below we’ve separated out the age demographic of all website visitors and compared it to visitors who returned within a specified timeframe. Return visitors are usually people who are more interested and more likely to buy. Don’t forget that Google Analytics only captures online shoppers. To get the same kind of insights for all your customers, both online and off, check out the Clover Insights app, free on the Clover App Market.
Step 3: Determine which pages are important
Every buyer goes through a journey before making a purchase. Customers typically move from awareness, to consideration, to evaluation, to purchase. It’s your job to determine what they think about and look for in each of those stages and make sure the page they are on gives them the information they need to move on to the next step.
If 90% of the people who purchase also read through reviews before buying you may want to make the product reviews more prominent on key pages. Similarly, if 70% of people who eventually buy visited the homepage, you know this page is somehow important to people considering a purchase.
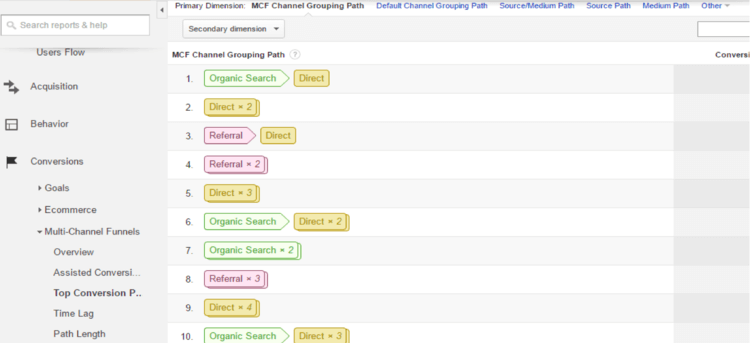
To view the customer’s path through your site, Click on the “Conversions” tab in the left rail, then on “Multi-Channel Funnels” and then on “Top Conversion Paths”. Then click on “Secondary dimension” above the list and choose “Landing Page URL Path”. This shows you which pages converting visitors visited and in what order.
For a quicker way to view this information graphically, try looking under “Behavior” and click on “Behavior Flow”. On the left side of the graph you’ll see which pages were the most popular starting points for people who converted. Click on one of them and select “View Only This Segment” and you’ll see which pages people visit after that initial landing page. In the case below, we’ve selected the homepage. Note that Google shortens URLs and won’t show your domain name. So if your website is widgets.com and your blog is widgets.com/blog, traffic to the blog will be shown only as “/blog”. Similarly traffic going to your webpage will be denoted simply as “/”.
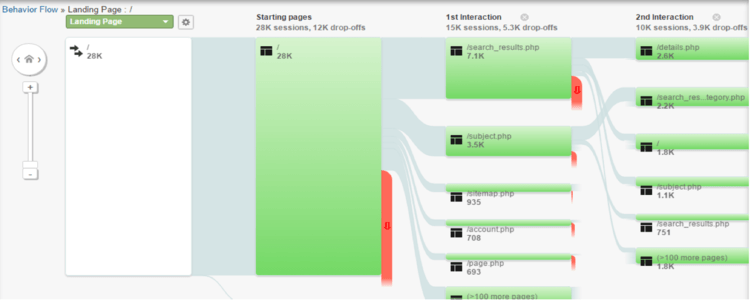
The screenshot above illustrates a segment of traffic that started (Starting page) on the homepage. Of the 28K sessions that started on the homepage, 12K dropped off the site, 7.1K used the search box, 3.5K used the subject drop-down menu, 935 used the sitemap, and 708 went straight to their account. The “Second interaction” indicates where the traffic went from there: 3.9K dropped off the site, 2.6K looked at details of a product, 2.2K used the search feature, 1.8K went back to the homepage, 1.1K clicked on a subject in the menu navigation, and 751 went back to their previous search results. This tells us, at a high level, that the homepage is very important, as is the search box and “subject” navigation, so making sure these pages are both a good user experience and include key purchasing information s very important. In contrast, if you find a campaign you’re running isn’t converting as many customers as you had hoped, try funneling that traffic into the top converting landing page.
We’ve only scraped the surface of what great analytics can do to help you improve business. Check out Clover Insights to learn how analytics apps can help you increase sales.
[lead image: Google_Analytics by Manop on flickr]Related Posts

How to make an unbeatable in-restaurant experience

How to grow gym memberships via gym culture
Popular Topics
Stay in touch
Sign up and learn more about Clover.
More posts about starting a small business


eBook