
Clover Reporting takes the hard work out of forecasting by tracking and sorting your data for you. Our reports can help you with day-to-day accounting and also measure your business’s health with these 9 numbers. Clover Reporting is available on your mobile app, your Clover device, or anywhere you access your Clover Dashboard (although not all reports are available at every location).The Clover Web Dashboard provides access to the most complete information. Here are some of the most useful reports for forecasting sales and managing cash flow.
Report name: Sales Overview
What it shows you
The Sales Overview rolls up your sales reports into one where you can see overall trends in such things as gross sales, net sales, average ticket size, and amount collected for a selected time period. Clover Reporting allows you to filter your data by time period, employee, order type, source of order, and by Clover device. All of the categories, filters, and terms used in this report are defined here to make sure you’re interpreting them correctly.
How to forecast sales for the next few months
Look at the data ranges for which your business had significant changes—a local lockdown, perhaps—and look at all the variables the report includes. Take note of what people were still buying during each period, and how they chose to make those purchases.
Your Sales Overview report includes:
- Revenue class, which reveals what kinds of products were selling and during what time period. For example, if you’re a restaurant, this shows your sales from alcohol versus food. A salon might see haircuts versus sales of products.
- Source of order, which tells you through which channel your sales are arriving—in-house, to go, BOPUS (buy online, pick up in store), or online with delivery.
- Top categories, which reveals the types of products or specific items you sold most.
- Compare to prior periods, which reveals whether you gained or lost sales. Then take a look at year-over-year sales to see how a particular month compared to the same month last year.
Pro tips for interpreting data
- Review your labor costs, which are often your greatest expenses. You should monitor this relative to sales on a regular basis.
- If you compare periods of time, you can see how consumer spending patterns may have changed in the last year. Did your most loyal customers start ordering online only, or do they prefer takeout? Did they continue to buy the same products, or did you have increased demand on specific products or services? Did people still try new products, or did they stick to comforting classics? Did a promotion help improve customer demand, or did it fall flat?
- Often lockdowns will create pent-up demand, especially for in-person services such as haircuts, manicures, or massages. Do you see patterns of high sales following a loosening of restrictions? How can you plan for that going forward?
- An order can have multiple statuses, not just paid or unpaid. Customers can partially pay for an order or even split an order among multiple cards. If you see an increase in partial or split payments it could be a sign that your customers are struggling to pay. Partial payments can also be problematic with your own cash flow, so you may want to limit how many partial payments you’ll accept.
Find the Sales Overview report here
Report name: Sales Summary
What it shows you
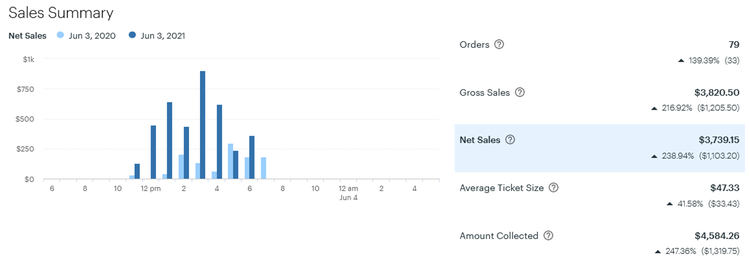
Sales Summary is a more detailed version of the Sales Overview report. It breaks down the time period side-by-side in a numerical format. This is useful to discover your peak periods—either during the week or even over the course of a single day. It also gives you a snapshot of key numbers like average ticket size, amount collected and net sales with trends for each.
Pro tips for interpreting data
Reduce your overhead costs by forecasting your staff needs. You can do this by identifying your peak periods and how customers are preferring to purchase from you. Customer pickup, for example, often requires less staff than full-serve.
Find the Sales Overview report here
Report name: Item Sales
What it shows you
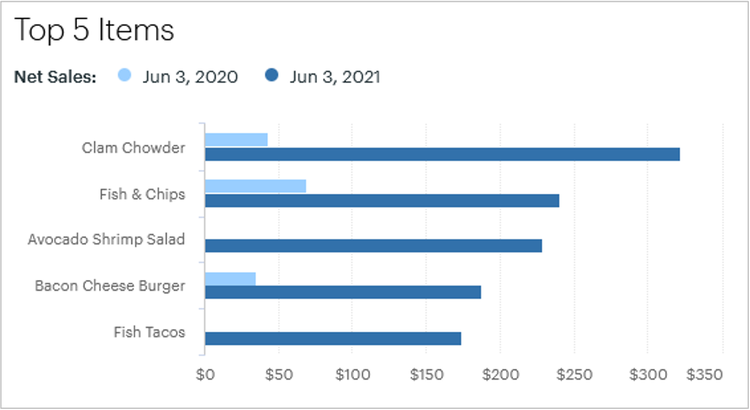
Items Report tells you which of your products sell the best. Top 5 Items (pictured above) shows your top sellers with a year-over-year comparison, and you can dive deeper from here.
You can apply filters to this data to determine which classes of products perform best (for example, wine versus beer), which products had the most returns, or which products sold…but at a steep discount?
Pro tips for interpreting data
- This report is especially useful for tracking inventory to make sure you have enough stock of popular items and don’t have your cash tied up in products that aren’t selling.
- Use this report to determine which of your products have the highest profit margin. You may sell donuts like hotcakes, but if you aren’t making enough profit on them you can run into cash flow problems.
- Identify when you are selling those high-profit-margin items, and ideate on how you can sell more of them.
- Looking at rows of data can be confusing—look only at the data you want by clicking on the “Display” tab and customizing your report.
Find the Item Sales report here
The last several years have brought new challenges to every business. But accurate forecasting can help you stay ahead of change. Keeping pace with your numbers and sales on a daily basis is not only smart, it can also help you pivot accordingly. Clover Reporting is an extremely powerful tool to help you do just that while managing your cash flow.
To learn how a Clover POS system enabled with powerful tracking and reporting can help your business, reach out to a Clover Business Consultant today.
Stay in touch
Sign up and learn more about Clover.
More posts about starting a small business



Related Posts

Start a small business